Greenson Innovation Hub
We Design the Intelligence Between the Field and the Decision
Greenson combines field instruments, existing operational systems and locally developed intelligence into one IIoT architecture. We can prepare site data, train and validate machine-learning or AI prediction models, then deploy the approved pretrained model to an Edge AI device at the site and integrate its outputs into the operational workflow.
Sensing feeds the system. Edge, Intelligence and Delivery are built locally in-house by Greenson.
How Greenson delivers Edge AI
Edge AI means the trained model runs inference at the site, close to the asset. It can continue producing approved predictions or classifications with low latency and without depending on a continuous cloud connection.
Locally developed, strengthened through academia. Greenson develops and delivers the architecture, model pipeline and site deployment while working closely with academic researchers on specialised methods, experimentation and validation.
Tailor-Made IIoT System Architecture
No two sites have the same instruments, power supply, communications, operating procedures or risk profile. Greenson begins with the operational problem, then designs the sensing, connectivity, edge processing, data structure, model-development pathway, dashboard and response workflow as one system. Where prediction adds value, the model is trained and validated before its approved version is deployed to the site Edge AI device.
Existing and new data
Field measurements
Flow, level, quality, weather, energy, asset and structural data
Operational systems
PLC, PID, SCADA, historian, work orders and laboratory records
Optional visual data
CCTV or inspection imagery where visual context adds operational value
Approved external data
Weather, hydrology, GIS or enterprise information where access is available
Greenson-designed intelligent layer
Connect, contextualise and process
Edge devices and software make unlike data usable together before presenting the right information to the right user.
Operational outcomes
One operational view
Live status, trends, alarms, evidence and system health
Early warning
Thresholds, anomaly indicators and forecasts where validated
Response workflow
Escalation, acknowledgement, inspection and action history
Guarded integration
Advisory or approved automation while existing safety logic remains active
The objective is not to replace proven infrastructure. It is to add the data path and intelligence needed to understand the operation as one connected system.
Our Engineering Method
Operational assessment
Define the problem, users, decisions, constraints and measurable outcome.
Architecture design
Plan measurements, network topology, edge devices, data flow and interfaces.
Data and model development
Prepare data, engineer features, train models and validate them against the defined outcome.
Edge deployment
Integrate sensors and gateways, then deploy the approved pretrained model to suitable Edge AI hardware.
Commission and improve
Verify site performance, monitor model behaviour and retrain or revise when evidence supports it.
Locally Built Capability
Greenson develops the Edge, Intelligence and Delivery layers as one connected solution
The same team links field data to the model, packages the approved model for site deployment, integrates its outputs into the dashboard and maintains the validation and improvement cycle. This prevents the model, edge device and operational workflow from becoming separate disconnected products.
Applied research with a route into the field
Close work with academic researchers strengthens modelling methods, experiments and technical validation. Greenson contributes the operating problem, field data, system architecture and deployment pathway required to turn research into a usable solution.
Why This Is Different from Product Reselling
Typical product reseller
Hardware is selected from a catalogue, often around one manufacturer’s range.
Device firmware forwards data, with limited site-level processing or adaptation.
Generic dashboards, fixed thresholds and vendor-defined analytics are supplied.
Product commissioning and warranty support are completed, then the data is handed to the client.
Greenson system architecture
New and existing measurements are selected as one coverage, integration and reliability plan.
Site processing, buffering, data-quality checks and the execution of approved pretrained models are designed into the solution.
Greenson prepares the data, trains and validates prediction models, then controls which approved model version is released for deployment.
On-site deployment, dashboard integration, commissioning, model monitoring, retraining and lifecycle support remain connected.
A reseller supplies the measurement. Greenson designs how that measurement becomes context, foresight, a decision and an operational response.
Dashboard Development and Operational Workspaces
A useful dashboard is not a wall of charts. It is an operational workspace designed around who is looking, what decision they must make and what should happen next. Greenson can combine live instrumentation, existing SCADA and PLC data, alarms, validated model outputs, maintenance records, approved external information and camera evidence where it is relevant.
From Live Data to an Operational View
Network status
Stable
Live field and system overview
Sites requiring review
Attention
Prioritised by operational consequence
Prediction window
Available
Where validated models are deployed
Data health
Monitored
Freshness, quality and communication
River level: actual, threshold and predicted trend
Example onlySite and data status
One viewPriority events
Evidence and contextThe screen is the end of the workflow, not the beginning. What appears here is determined by the measurement plan, edge logic, alarm philosophy, user roles and response procedures designed earlier.
What the Operational Workspace Can Include
Live Monitoring
Map, asset and process status
Bring geographically distributed sites, equipment and process measurements into one operational hierarchy.
- Site and device health
- Map or process views
- Current and historical values
Early Warning
Alarms with context and priority
Move beyond a list of threshold breaches by showing severity, trend, affected location, evidence and required response.
- Multi-level escalation
- Approved notification channels
- Acknowledgement and closure
Analytics
Trends, statistics and predictions
Compare periods, detect drift and present validated model outputs beside the actual measurements they depend on.
- Statistical analysis
- Actual versus predicted
- Performance and risk trends
Visual Evidence
Camera and event verification
Where computer vision or CCTV is used, associate imagery with sensor events to help explain what changed at the site.
- Event-linked snapshots
- Visible state or obstruction context
- Evidence retained with the event
Operations
Maintenance and response workflow
Connect alarms to inspection priorities, work orders, operator comments and follow-up evidence.
- Responsible team and due time
- Action and resolution history
- Recurring maintenance visibility
Coordination
Different views for different users
Control rooms, management, field teams and approved departments do not need the same screen or level of access.
- Role-specific dashboards
- Mobile and desktop views
- Shared incident picture
From Detection to a Closed Operational Loop
Detect
A sensor, rule or validated model identifies a threshold, anomaly or predicted condition.
Verify
Check data quality, adjacent signals, operating state and camera evidence where available.
Escalate and act
Notify the correct team, advise an inspection or pass an approved recommendation into the existing workflow.
Close and learn
Record acknowledgement, action, outcome and evidence so reports and future model versions improve.
Deployment and data governance are part of the dashboard design
The architecture is aligned with the client’s cybersecurity, regulatory and operational requirements. The final arrangement is confirmed during system design.
Scope is evidence-led. Forecasting, cross-department notifications, external warning outputs or control recommendations are included only when the project has the necessary data, approvals, interfaces and validation path.
Greenson Operational Intelligence Platforms
These four platforms form Greenson’s current product portfolio. Each platform provides a repeatable operational structure—dashboard, data model, alarm and workflow framework, integration pathway and optional Edge AI—while the instruments, communications, analytics and deployment scope are configured for the actual site.
Productised platform core, engineered around each operation
The platform is the reusable product. Greenson then configures its sensing coverage, field connectivity, user roles, model requirements, hosting arrangement and operational workflow for the client’s assets and responsibilities.
Flood & Urban Drainage Platform
More warning, less guesswork
Rainfall, upstream level, drainage flow and approved visual observations are combined to provide earlier visibility of developing flood and drainage risk.
- Catchment, low-point, culvert and drain monitoring
- Tiered thresholds, predicted trends and escalation
- Dashboard, event history and approved warning channels
- Optional camera evidence or computer vision where useful
Reservoir & Dam Monitoring Platform
Hydraulic and structural data together
Water level and rainfall can be viewed alongside displacement, pore pressure, deformation and inspection evidence within one operating picture.
- Reservoir level, rainfall and operating-condition views
- Structural and geotechnical trend monitoring
- Inspection, event verification and escalation workflow
- Role-based access and auditable history
Irrigation & Water Delivery Platform
Measure what is delivered
Level, flow, gate position, soil and weather data support remote operation, transparent allocation and a clearer record of water movement through the scheme.
- Solar-powered and communications-constrained sites
- Gate position, discharge and delivery records
- Remote commands with manual override retained
- Scheduling, exceptions and operational reporting
Water Quality & Environmental Platform
Deploy more points where coverage matters
Value-engineered sondes and sensors can extend monitoring density, while specialist instruments are specified where measurement consequence, certification or compliance requires them.
- Multi-parameter water-quality monitoring
- Weather, soil, hydrology and approved external inputs
- Sensor-health, data-quality and maintenance visibility
- Open integration with dashboards and validated models
Machine Learning and Predictive Intelligence
Machine learning can help when an operational decision depends on relationships across time, multiple measurements or changing conditions. It is introduced only after the decision, available data, validation method and operating limits are clearly defined.
From raw site data to a deployable pretrained model
Greenson can manage data preparation, feature engineering, model selection, training, evaluation, version control, Edge AI deployment, performance monitoring and retraining as one continuous engineering process.
Research capability connected to field implementation
Our close collaboration with academia gives the team access to specialised research methods and technical challenge, while Greenson provides field context, integration and a practical route to deployment.
Not every problem needs a model
Reliable measurements, calculations and well-designed alarms often solve the problem. Machine learning is used where it adds evidence that rules alone cannot provide.
Forecasting
Estimate likely future level, demand, quality or operating conditions within a defined time window.
Anomaly detection
Identify behaviour that differs from normal operation across several related signals.
Condition and efficiency
Track asset-health indicators, performance drift and maintenance priority.
Sensor-health intelligence
Recognise frozen, drifting, inconsistent or implausible measurements before they mislead operators.
Water and Catchment
Level and flood forecasting
Combine rainfall, upstream level, catchment conditions and downstream response.
Water Quality
Disturbance prediction
Relate intake conditions, weather, process response and historical observations.
Assets
Fault and efficiency trends
Use hydraulic, electrical, vibration, temperature and maintenance information together.
Operations
Prioritisation and advisory
Rank inspections, alerts or recommended actions within approved operating limits.
Computer Vision — A Dedicated Edge AI Capability
Computer vision is a separate capability for applications where a camera can observe an operational condition that conventional instruments cannot describe efficiently. It is not added to every project. The model, camera position, lighting, event definition and validation method must be designed for the actual site.
How a Site-Specific Vision Model Is Developed
Define the event
Specify exactly what must be detected, counted, classified or tracked.
Collect representative video
Capture real lighting, viewpoints, backgrounds, weather and operating conditions.
Annotate the data
Label the objects, states and events the model must learn.
Train and evaluate
Develop the model and measure performance against unseen site data.
Deploy at the edge
Run inference close to the camera and integrate outputs with the platform.
Review and improve
Use verified field outcomes to refine the model as conditions change.
Flagship Computer Vision Example
Swiftlet Monitoring System
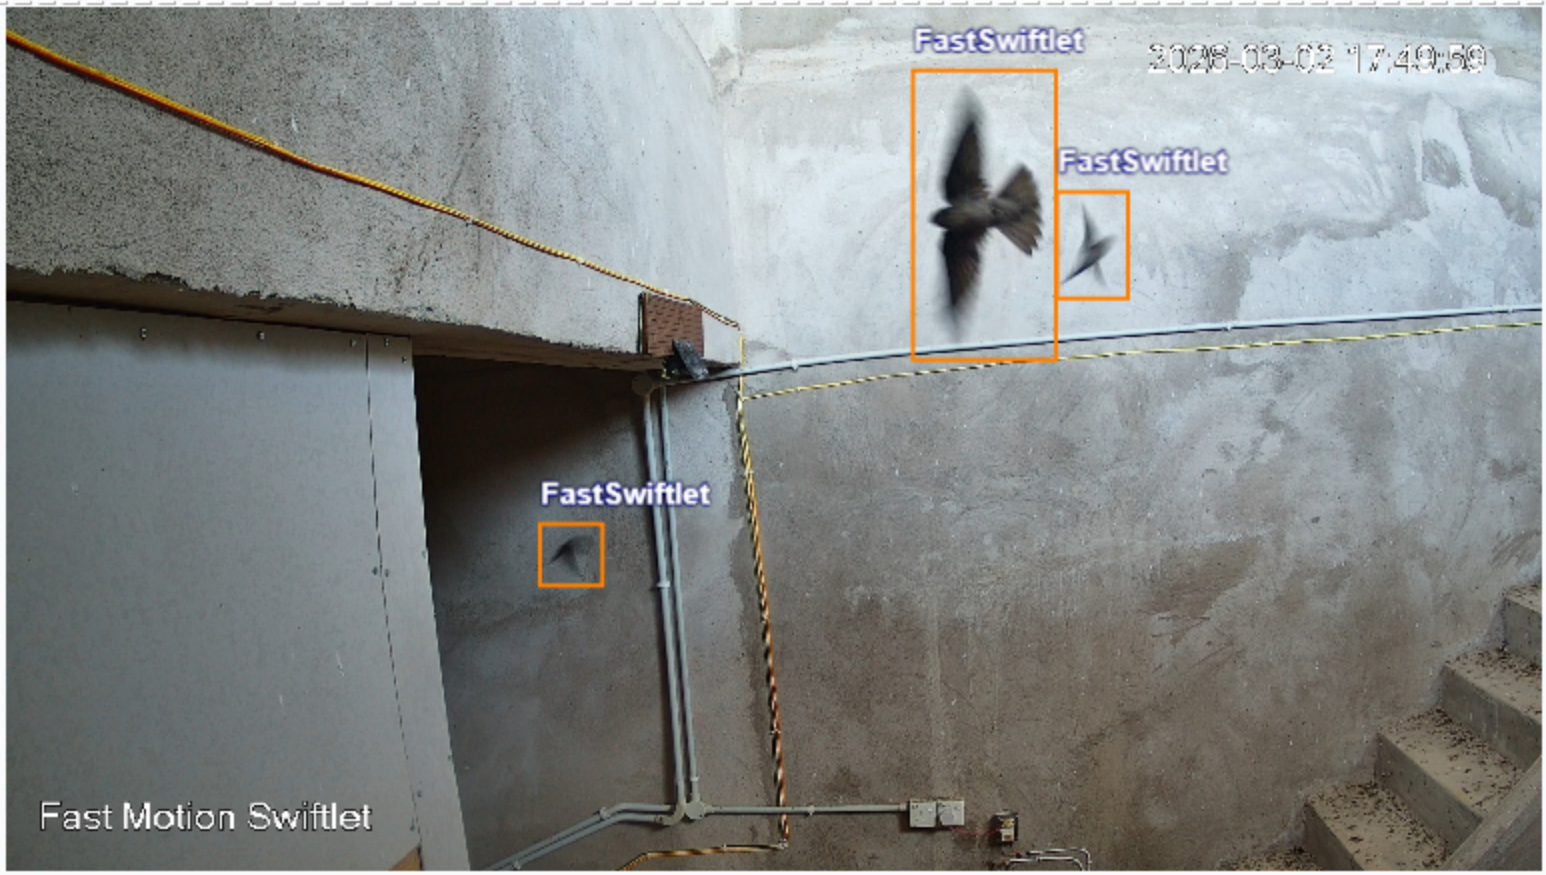
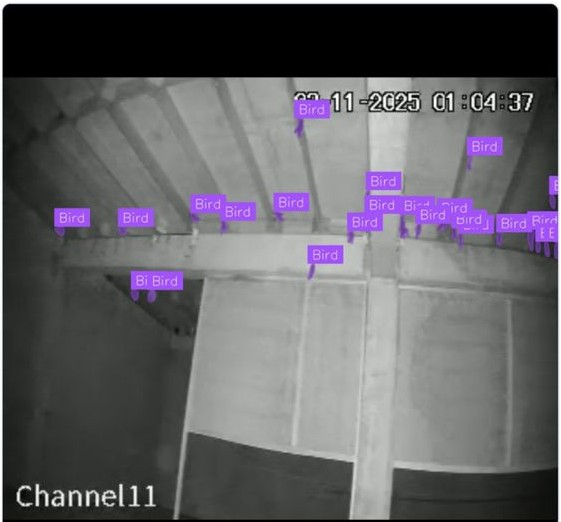
The Greenson Swiftlet Monitoring System transforms conventional CCTV infrastructure into an AI-powered monitoring platform. By integrating computer vision and Edge AI, the system detects swiftlet activity and converts raw video streams into structured operational information.
Computer vision demonstration: existing CCTV footage is processed into structured bird-activity information by a site-specific model.
Automated bird activity monitoring
Detects entry, exit and internal movement without continuous manual video review.
Data-driven population insights
Provides objective indicators of bird activity and population trends over time.
Nest and internal occupancy monitoring
Identifies bird presence and activity within the birdhouse environment.
Invasive species detection
Flags non-swiftlet species, predators or intruding birds for operator review.
Behavioural pattern analysis
Builds an evidence base around activity cycles, movement and environmental response.
Uses existing CCTV infrastructure
Turns conventional surveillance cameras into structured operational data sources.
Applied AI and Automation Model Development
Beyond dashboards and computer vision, the Innovation Hub can develop task-specific models for industrial, infrastructure, agricultural and automation applications. The starting point is always a defined operational problem, available data and a practical route to validation.
Time-series and operational models
Models built from measurements, process states, equipment history and verified outcomes.
Perception and automation models
Task-specific perception for robotics, inspection, tracking and supervised automation.
Greenson does not position AI as a universal replacement for engineering logic. Models are used where they can be tested, understood and integrated safely into the operating workflow.
Field Development and Collaboration
Innovation moves faster when solutions can be developed against real equipment, real weather, real users and real operating constraints. Greenson uses its agricultural assets and specialised birdhouse facilities as practical operating environments for data collection, model development and deployment learning. We also work closely with academic researchers, combining research depth with Greenson’s field access, IIoT architecture and implementation capability.
Field access allows the team to collect representative data, test deployment constraints, validate outcomes and improve a solution before wider scale-up.
Birdhouse computer vision
Live cameras, real movement, difficult lighting and operationally meaningful events.
Agricultural environments
Plantations and farms provide practical settings for sensing, telemetry and automation trials.
Client pilot projects
Controlled pilots establish the data, acceptance criteria and implementation pathway.
Research collaboration
Applied research can connect domain expertise, field access and deployment capability.
Start with the Operational Problem
Tell Us What Your Team Needs to See, Predict or Act On
We will help define the measurements, data path, edge processing, dashboard, model requirements and pilot scope. Computer vision will be included only where it adds genuine operational value.